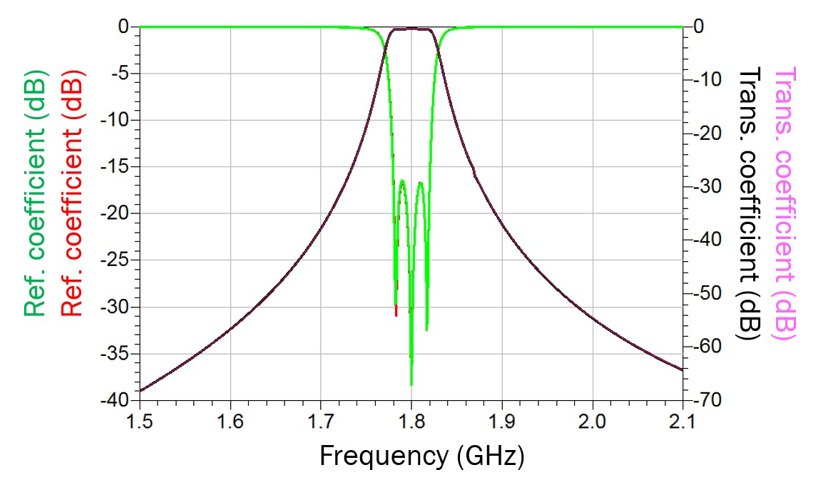
Fig. 15 Final filter response of Fig. 8 after applying correction to capacitors C1 = 0.35 fF, C2=-0.91 fF and C12
= 0.23 fF (red and black) and without correction capacitors (green and purple)

Fig. 15 Final filter response of Fig. 8 after applying correction to capacitors C1 = 0.35 fF, C2=-0.91 fF and C12
= 0.23 fF (red and black) and without correction capacitors (green and purple)
Other Posts
Leave a Reply